
Top 9 Product Analytics Software To Try In 2022
Product analytics software assists managers and product owners in analysing product performance in terms of key performance indicators such as visits, engagement, interactions, behaviour patterns, and so on, in order to improve the overall product experience and meet business objectives.
The primary goal of product analytics software is to deduce product benefits from data by engaging people.
What is the distinction between product analytics and web analytics?
Product analysis and web analytics both assist businesses in meeting their objectives. However, their approaches differ greatly.
Product analysis focuses on a company’s products or services and gathers data from many sources to determine client behaviour. This approach is designed to give decision-makers insight into how customers engage with the product and to help them enhance the product or service.
Data insights from product analytics software are used to illustrate correct consumer behaviour. Facts based on this data may be utilised to improve user experience, and features, align your roadmap with user demands, and increase acceptability and conversions. They can also supply insightful information, tools for increased automation and visualisation, and a variety of other services.
Web analytics is the act of tracking and evaluating how people (web traffic) arrive at a website and navigate through its pages. These steps are taken to improve website efficiency, expand the company’s reach, and optimise online usage.
What is the distinction between Google Analytics (GA) and Product Analytics (PA) software?
Google Analytics (GA) is a web analytics software. It monitors particular user activities on a website and gives analytics like page views, sessions, unique visitors, average duration per page, and so on.
Without a doubt, GA gives excellent free data that assist website owners in optimising their sites for increased online traffic. Product Analytics (PA) employs more realistic user behaviour data, whereas GA analyses anonymous traffic.
Google Analytics (GA) has limitations compared to Product Analytics (PA) software.
- Because GA offers a summary of the entire event, it is difficult to tell what users were doing before and after the drop point.
- PDF downloads, video views, form submissions, and other non-HTML content cannot be tracked.
- No raw data: GA gives difficult-to-analyze bespoke data for comprehensive insights.
- Due to some users’ having cookies and JavaScript disabled in their browser, Google Analytics collection tags, libraries, and SDKs are not visible. Exact figures may be accessed on Google’s website.
- GA does not support the processing of PII (Personally Identifiable Information). As a result, determining the value that specific users obtain from your product is impossible.
- In Georgia, there is no specific customer service or assistance.
- The PA gives valuable information to your users based on broken features and assists in the optimization of efficient features. You can engage customers for longer, keep them, and sell more if you understand what they do, how they interact with features, and what they like most about your product.
There are other additional advantages and benefits of using PA, which we shall describe in the next section.
The significance of product analytics software
Because most programmes are not built to create extensive reports on their own, product analysis is an important aspect of a company’s product management approach. Usage data is frequently misconstrued and unreliable in the absence of analytics. By combining all data sources into one organised perspective, product analytics software makes unstructured data usable. Here are a few additional benefits of PA:
- Product analytics Software enable product teams to examine information in greater depth than is feasible with human error-prone interviews, surveys, and conversations.
- Implementation of Features: While integrating product analytics is beneficial for businesses seeking to understand how their consumers utilise existing product features, it is also beneficial for testing new features and analysing user experience. When a team decides how many new features to implement, they may use the data supplied by product analytics to help them get there.
- Customer retention: In recent years, application development-focused technology organisations have discovered that product analysis is one of the most successful strategies to boost customer retention and maximise a company’s position in a competitive market.
9 best Product Analytics Software
Let’s take a look at some of the most effective product analytics software.
1. Woopra
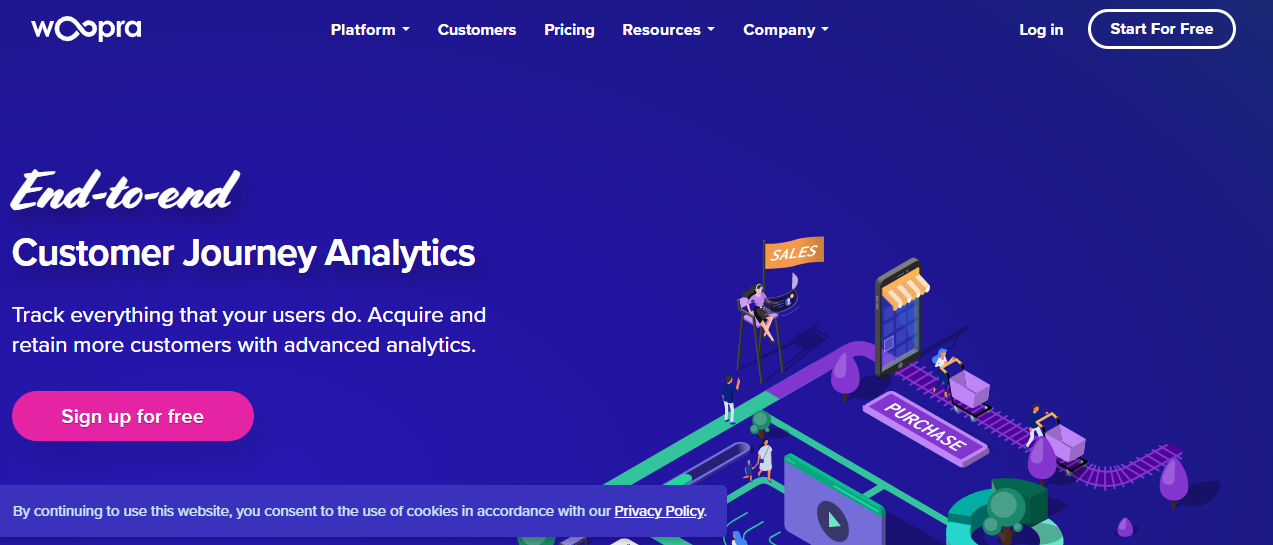
Woopra is a cutting-edge customer analytics software that generates real-time data on consumer activity. It assists businesses in analysing client lifecycles by automatically developing complete profiles.
Granular customer journey data such as web activity, page visits, device type, email activity, help desk, payments, support, and many more customer activities are generated by centralised views.
Its customisable reports assist businesses in examining client touchpoints and associated results in order to demonstrate brand equity and encourage product innovation.
The Woopra platform enables third-party solutions like Dropbox and Mailchimp to connect business data and exchange insights across organisational teams.
Features
- Three-dimensional models that are rarely encountered in the equation for displaying data to consumers
- Automatically track an infinite number of custom actions.
- Based on user behaviour data, dynamic triggers can be built.
- Schedule accounts to conduct sophisticated automatic operations like data sync, email list export, subscription addition/update, and more.
Through behavioural data analysis, the Woopra platform provides a unique user experience to marketing and support teams in order to meet corporate goals. The software is free to use for up to 500,000 activities every month, after which you will be invited to upgrade.
2. Pendo

Pendo assists businesses in understanding how their product qualities are perceived by consumers and how multiple pathways through the product lead to improved business insights.
It is used to increase the adoption of software solutions by Fortune 500 firms, B2B technology startups, educational institutions, and healthcare systems.
Its distinguishing feature is that it blends in-app messaging with strong product analysis and user feedback, allowing individuals to successfully adapt to the software with minimal effort.
This platform enables product teams to collaborate on qualitative and quantitative information in order to make educated customer support choices across the product experience.
In summary, Pendo assists businesses in gaining an understanding of their goods, such as which features people utilise and neglect. Which choice is the best to select, which characteristic causes friction, and so on? This will assist the organisation in removing client pain points and developing new goods.
To maximise product value, the platform also assists in organising in-app messaging, manuals, and instructions without coding.
Features
- Easy and quick user orientation also aids in goal setting to align corporate results.
- Customers’ feature requests may be easily tracked, captured, and prioritised.
- Data insights may be used to better analyse client behaviour and discover revenue-generating activities.
- Comprehensive customer support systems that increase customer happiness while decreasing expenses and increasing customer competency.
Pendo software assists businesses in providing better product experiences for happier, more productive people by encouraging innovation. It is free to use for up to 1000 active users each month.
3. Mixpanel
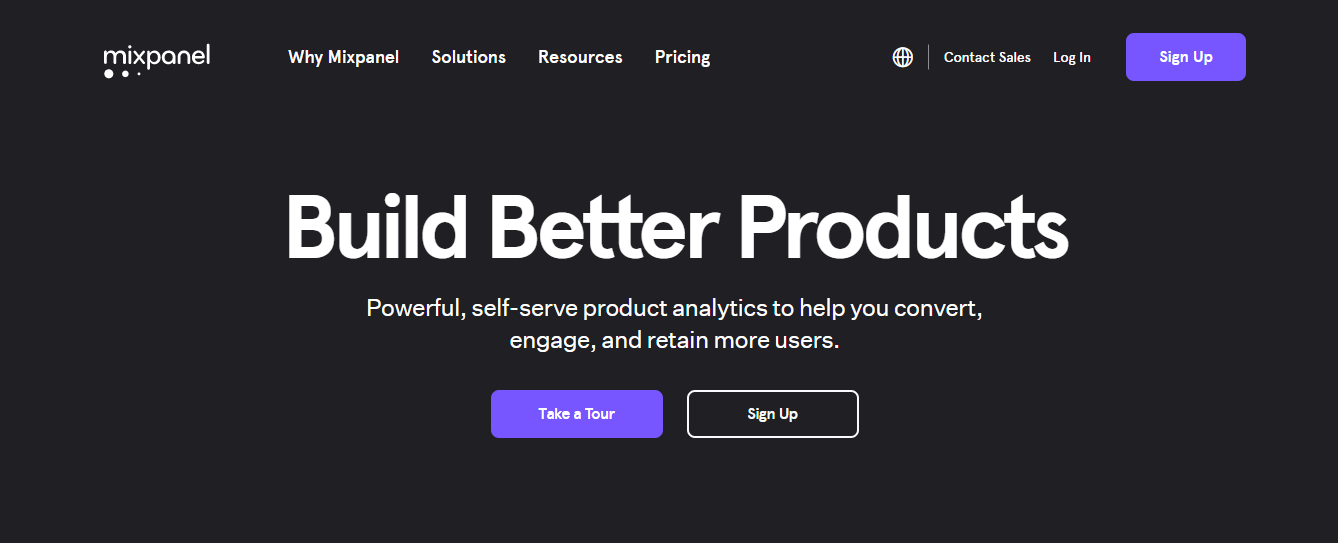
Mixpanel assists you in better understanding user behaviour in order to make better judgments regarding your SaaS services.
It offers event-based product analysis, which analyses particular user interactions in real time in order to efficiently spot patterns and understand consumer behaviour.
Because user data protection is critical, this software includes privacy features for data compliance and international data transfer requirements including GDPR, CCPA, HIPAA, and others.
Its event-based method captures a more precise picture of user involvement, allowing for more detailed analysis and more effective message and experiment targeting.
To secure client privacy, the software team uses development methodologies such as built-in SOC 2 Type II certification, role control, and enhanced encryption.
Interactive reports provide extensive visualisation of user-specific data, such as which users remain for how long, grouping users by activity, correlating user behaviour to long-term retention, where and why customers leave, and so on.
To offer in-depth and appropriate analysis of user-specific tasks, the detailed level of analysis comprises user concepts, events, and characteristics. The following are some examples of users, events, and properties.
Features
- impact report to determine the launch’s success.
- Custom properties with simple formulae that don’t require a development team
- Mixpanel data can be easily synced with the rest of your interoperability stack.
- Dashboards provide an overview of product uptake, retention, or other bespoke KPIs.
- To reduce friction, identify critical user pathways.
Mixpanel is a straightforward yet effective product analytics software for increasing user conversion, engagement, and retention. A free version is provided to the first 100,000 users.
4. GoodData

GoodData offers a BI (Business Intelligence) platform for creating and delivering product analysis that aids in the development of data strategies for building new goods in order to boost a company’s ROI (Return on Investment).
Without any training, easy-to-use adaptable dashboards enable any manager to generate their own new reports and personalise visualisations, dashboards, and more.
Its adaptable design enables organisations to simply integrate with existing infrastructure and offer analytical solutions to employees, customers, and business partners.
Integration with multiple data warehouses and databases is also feasible, including AWS Redshift, BigQuery, Snowflake, PostgreSQL, and Vertica.
By utilising industry best practises and cutting-edge technology, GoodData ensures the greatest degree of data protection. This platform employs numerous levels of security in accordance with worldwide standards such as GDPR-S, SOC2, PII, ISO, CCPA, and others.
Features
- Enterprise Security and Shield protect company and consumer data.
- Dashboards, charts, and analytics may be easily included using iframes and customised.
- The platform is available both on-premises and in the cloud.
- Scalability may be achieved in all dimensions, including data volume, cost, and user count, without losing data speed or IT flexibility.
GoodData is available for free for a limited time period of 5 workspaces. Pricing is based on features and data volume rather than users or queries.
5. Amplitude
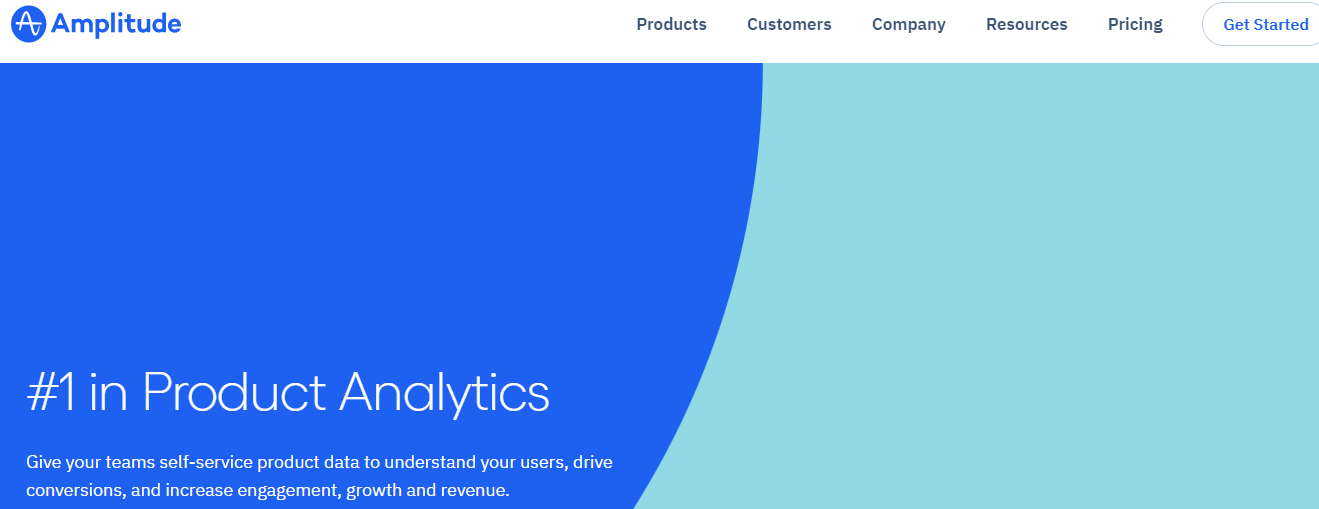
Amplitude is a pioneer in digital product intelligence and a $2 billion Nasdaq-listed firm. It ranks first in G2 Product Analytics and is used by 26 of the Fortune 100.
The primary goal of amplitude analysis is to understand consumers’ behaviour, personality, and engagement in order to optimise their experience by finding friction spots and following their trip.
It examines outcomes by gaining a better knowledge of conversions and enhancing client retention through product innovation.
The platform links digital items to clients directly. It adds value to digital investments by understanding indications that go beyond the surface level (page views and clicks), such as user characteristics, most utilised features, high-value customers, people engagement, conversion, and so on.
Features
- Behavioral Cohorts to acquire a more accurate picture of user behaviour
- Integration with third-party systems such as Amazon, AppsFlyer, Apptimize, Google Play, iTunes, mParticle, and others is simple.
- Data security and dependability are ensured by world-class data management and compliance standards.
- Baseline indicators aid in research, education, and forecasting.
- Machine learning (ML) is used to anticipate outcomes over time and assess the possibility of customers buying, rejecting, and so on.
Product managers, merchants, and developers should use this top digital product intelligence software. The free edition monitors 10 million activities every month and allows for unlimited user location and data storage.
6. Indicative
Indicative is a platform for product analytics that provides a unified picture of the customer experience across all data sources and marketing channels.
Because of the architecture’s scalability, you may connect to your existing data sources through storage/lake, CDP, or directly from your website or mobile app.
Its proprietary multi-funnel technology visualises and predicts which consumers are critical to acquiring, as well as identifies friction spots across multiple client groups for retention.
The software tracks the customer journey from beginning to end, including common paths; mapping to understand customer behaviour; building funnels for customer movement in products; understanding friction points where customers fail; and a variety of other indicators that aid in the creation of better products and increasing customer satisfaction.
Features
- Key performance indicators (KPIs) can be recorded and shared across teams.
- The dashboard is completely configurable with automatic updates.
- Customer behaviour may be analysed using several segmentation techniques.
- Analysis of groups to allow and detect recurrent consumer behaviour
The indicative platform, which is trusted by startups and businesses of all sizes, is ideally suited for product managers, merchants, and data analysts. The ordinary edition is free for the first three users and provides 25 million events each month.
7. Heap
Heap is made up of three major components: data analysis, data foundation, and data management. These three pillars assist in determining who uses the product; segmenting interactions; identifying product friction that leads to product enhancement; stimulating, activating, and maintaining conversions; and obtaining early indications of consumer behaviour change.
Because the heap automatically accumulates all user interactions, there is no need to alter code when new features or reductions are implemented.
The data model is extensive, offering funnel analysis, retention analysis, user segmentation, behavioural groupings, and other features that aid in the creation of more useful goods that match company objectives.
Features
- Improved data collection and analysis to trace the full client journey
- The Event Viewer allows you to define events without having to change raw data sets or write code.
- Instead of determining which events to capture in advance, automatic data collection collects consumer interactions.
- Create custom reports and easily add them to the dashboard.
Without a technical staff, Heap is one of the simplest platforms to set up for smaller and enterprise-level applications. With an unlimited user licence, this software can be used for free for up to 10,000 sessions each month.
8. Countly
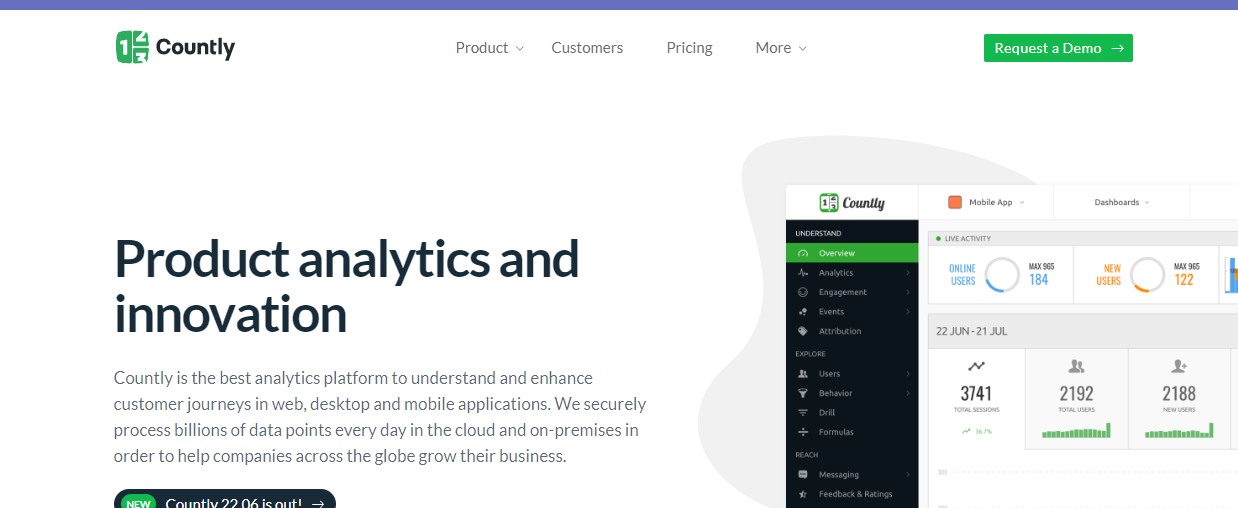
Countly is the world’s premier product analytics platform, assisting in the tracking of product performance and measurement of innovation in order to improve customer experience and satisfy company objectives.
Its enormous reach records over 1.5 billion unique identities across over 16,000 apps and over 2,000 servers globally.
Its cutting-edge technology collects real-time programme usage and click activity from platforms such as mobile, desktop, online apps, and websites and displays information in a visual style to evaluate user behaviour.
On the dashboard, real-time statistics such as views, entry and exit pages, bounces, page duration, heatmaps, and so on are recorded and forecasted.
To enhance the software’s functionality and usability, numerous plugins relating to user profiles, sophisticated segmentation, behaviour analysis, alerts, and so on may be included.
Features
- Building segmentation tailored to the demands of the enterprise
- It may be used in a corporate setting or in a private cloud.
- Using a checksum technique to ensure the integrity of data
- The app’s health and productivity counters monitor for crashes and problems.
The Community Edition is free to use but requires server hosting at a cost, whereas the Enterprise Edition includes premium plugins and bespoke SLAs and may be hosted on-premises or in the cloud.
9. Segment

Segment is used to collect data from different sources in order for the marketing and engineering teams to understand the customer journey in order to build creative products and track customer behaviour in order to achieve goals.
The unify dashboard gathers client touchpoints from all resources in order to create results-driven journeys such as continuous engagement, results-driven journeys, and omnichannel messaging.
Create real-time behavioural campaigns and analyse real-time data segments to target the correct customers.
One of the platform’s primary tasks is to ensure the security and confidentiality of client data, which is handled using the finest secure protocols: data encryption, domain identity management (SCIM), and multi-factor authentication (MFA), to mention a few.
Without any coding concerns, data collection may be sent to 300+ different real-time marketing platforms.
Features
- A basic analytics API may capture user events from any website, app, or repository.
- Data sharing dictionaries can synchronise nearly any organisational team.
- Real-time privacy evaluation with GDPR, CCPA, and other requirements
- Customer profiles may be segmented based on real-time customer behaviour and intent alerts, as well as stress lists.
The Segment platform has been certified to industry standards such as ISO 27001, 27017, SOC 2 Type 2, and others. The platform is free to use for a limited time, but it only enables 1000 visits per month from two sources with 300+ integrations.
How do you choose the finest product analytics software to get the greatest results?
The best software is determined by the product or service category, but in general, the following 7 elements will assist you in selecting the finest one that meets your needs:
#1. Custom Event Tracking: Record custom events such as button clicks, form fills, and page visits.
Automatic Retrieval: It relieves manual tracking teams by eliminating the requirement to pick which events to track ahead of time. It also aids in the tracking of trends.
#3. Low Code Reliability: This allows for easier monitoring of code integration and management for non-technical workers.
#4. Detention Reporting: Use consumer behaviours, pathways, and procedures to anticipate customer retention.
#5 Data segmentation enables data to be evaluated depending on specified criteria such as demographics, normal behaviour, and so on.
#6. Third-party integrations for improved optimization, visualization, and automation that benefit the entire team, such as B. Marketing, Sales, Customer Success, Product Management, and so on.
#7. Real-time data: Software that offers real-time information is better than software that takes many hours to read the data on the dashboard.
In Conclusion
The product analytics software described above works best and produces good findings.
Each tool is distinct and has its own set of features. Because no single tool can capture all functions, it is critical to identify the particular demands of the company or product, as well as the business objectives, and then select the proper product analytics software.